Improving Error Detection in Complex Trading Systems

QATS is a platform founded in Israel in 2021, designed for financial institutions, funds, and qualified investors, rather than the mass market. Due to its complexity and strict regulatory requirements, access to the platform is restricted, ensuring it is used only by experienced market participants. QATS is backed by AWS Activate (Amazon), highlighting its reliability and technological capabilities.
Product brief
QATS Workspace is a no-code platform for building and automating trading strategies. It allows professional traders, quants, and prop trading firms to create strategies using a modular block-based system, without writing code. The platform supports backtesting on historical data, real-time execution, and automated strategy adjustments using oracles. Built-in risk management tools help control capital allocation and minimize losses.
Problem
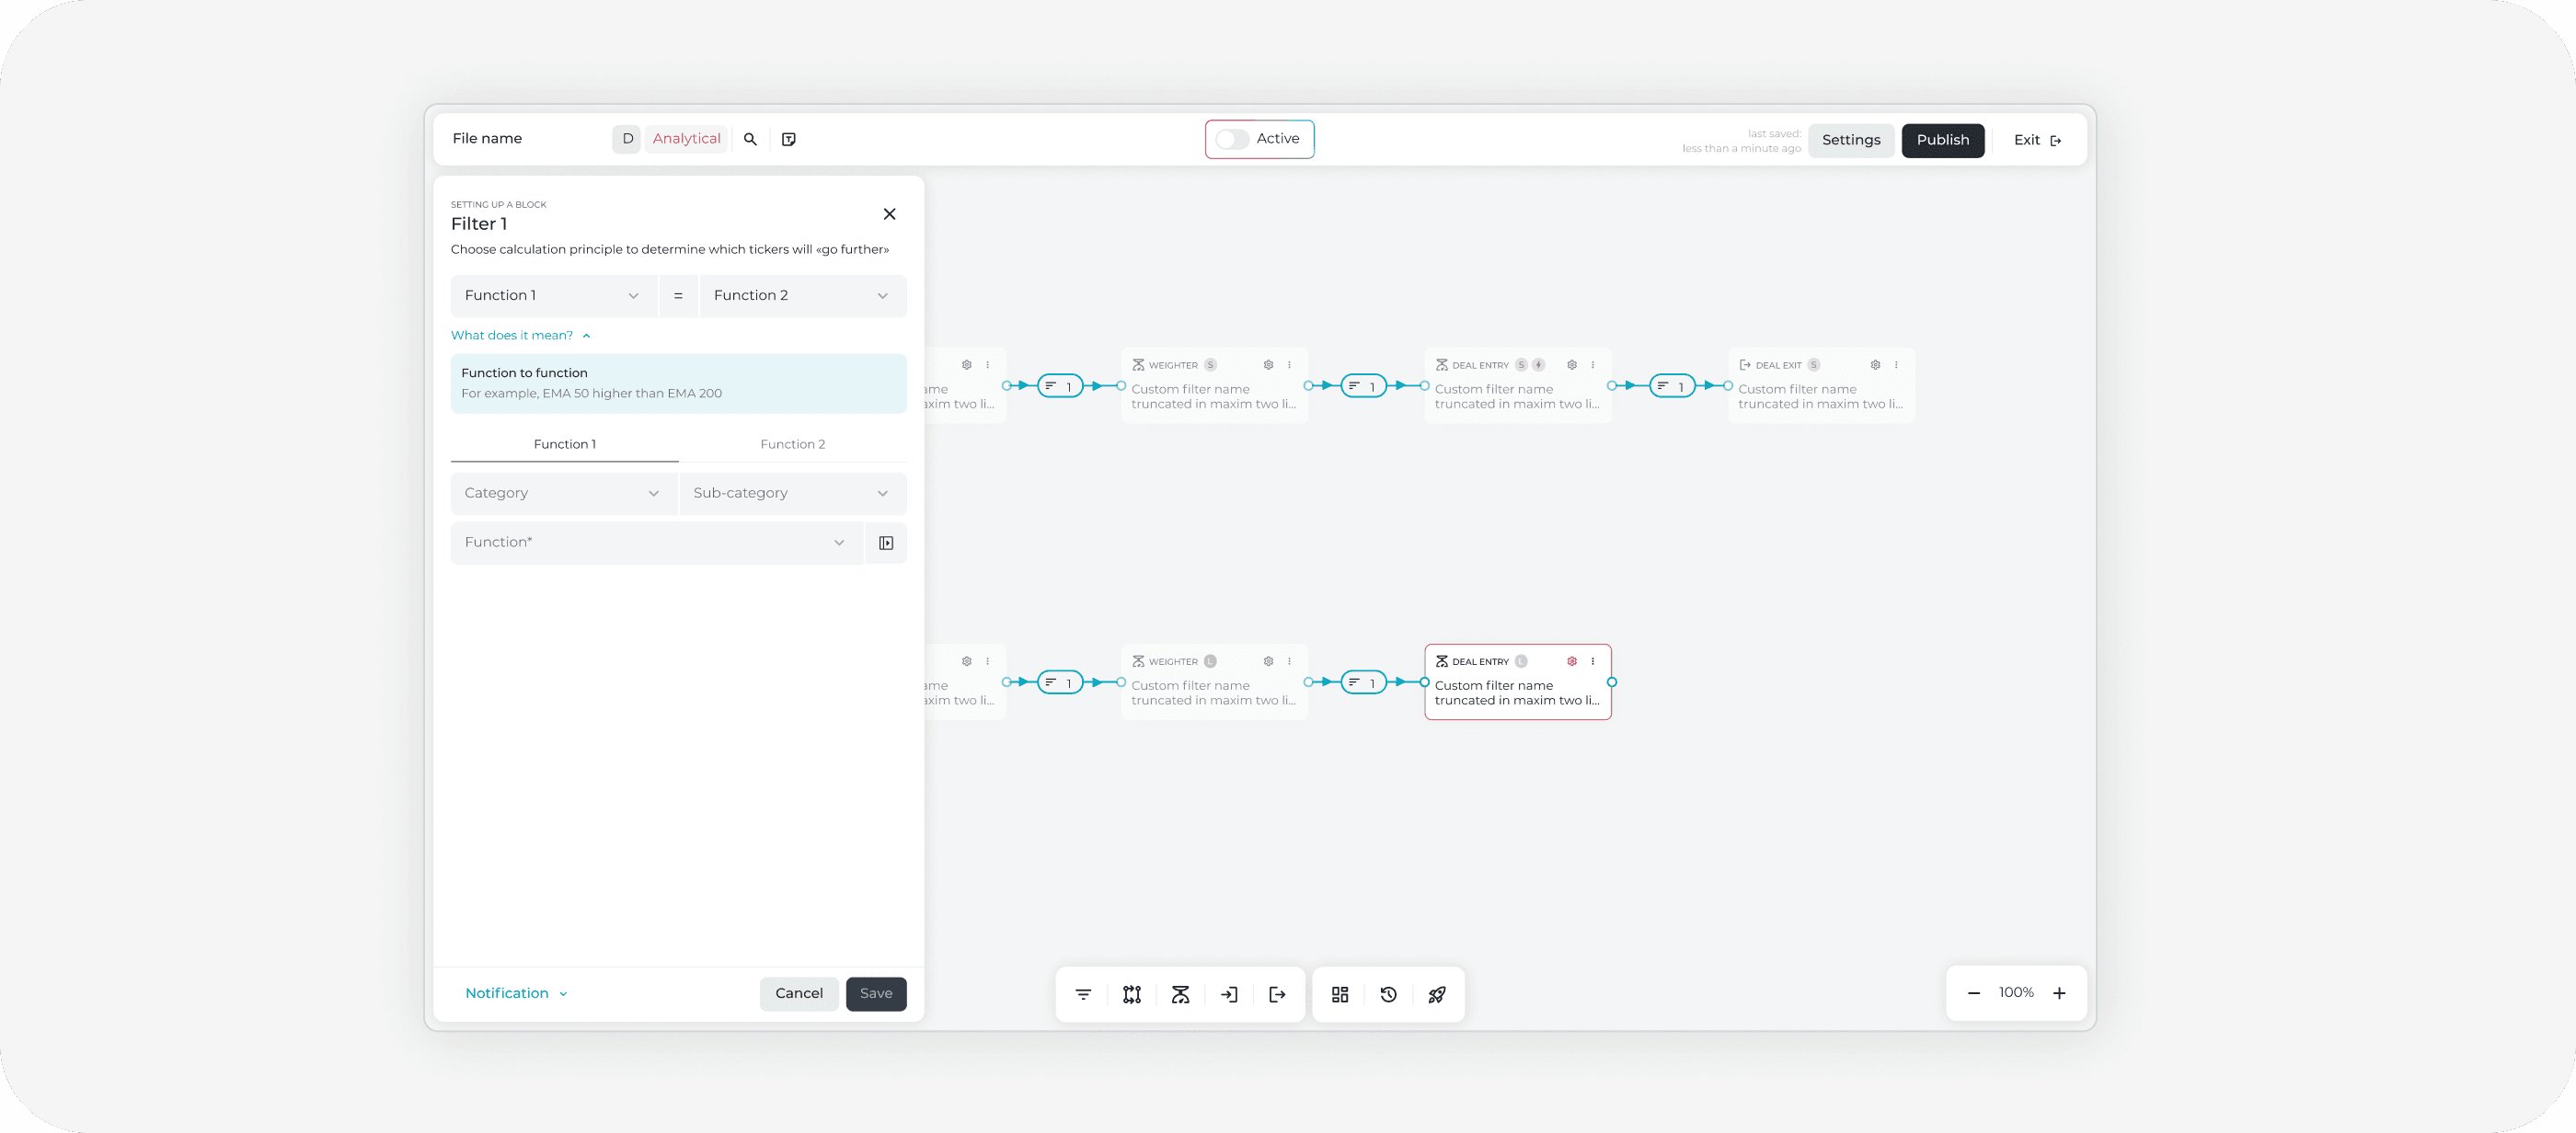
Once a strategy is built in the constructor, it needs to be activated – meaning that all monitors begin to run, and at any moment, when specific triggers set by the user occur, the chain may be triggered. The blocks will calculate the defined functions, and trading will take place. Errors can also arise at this moment. To analyze the strategy's performance and its errors, various widgets are provided that log all events – these can be added as needed.
After launching the MVP and testing the tool with a focus group, we found that:
7 out of 10 users were making about 1.5 times less profit than they could have because they were unaware of errors that did not block the strategy's operation but negatively impacted its performance.
2 out of 10 users did not receive any potential profit from their strategies because they were unaware that certain parts of their strategies were not working. Although such errors could be detected in the widgets, users had to suspect something was wrong in order to add them. However, there was no indication or hint to raise this suspicion.
My role & the team
Although I worked as a product designer, since this is a startup and we don’t have business analysts, I also took on both roles during the discovery phase.
I worked directly with the CEO and backend developers. I participated in field research with the focus group – observing users and analyzing their strategies with the CEO, clarifying and forming requirements for the backend developers, and designing layouts.
Constraints
In this case, we were fortunate as there were no significant limitations. The task also had branding value, so we were only limited by the technical capabilities of the front-end development, as our builder uses React Flow.
Process
In the beginning, the CEO and I analyzed the users' strategies from the focus group and identified the key errors and processes that needed to be displayed. After that, we met with the backend team to understand what data we could actually retrieve.
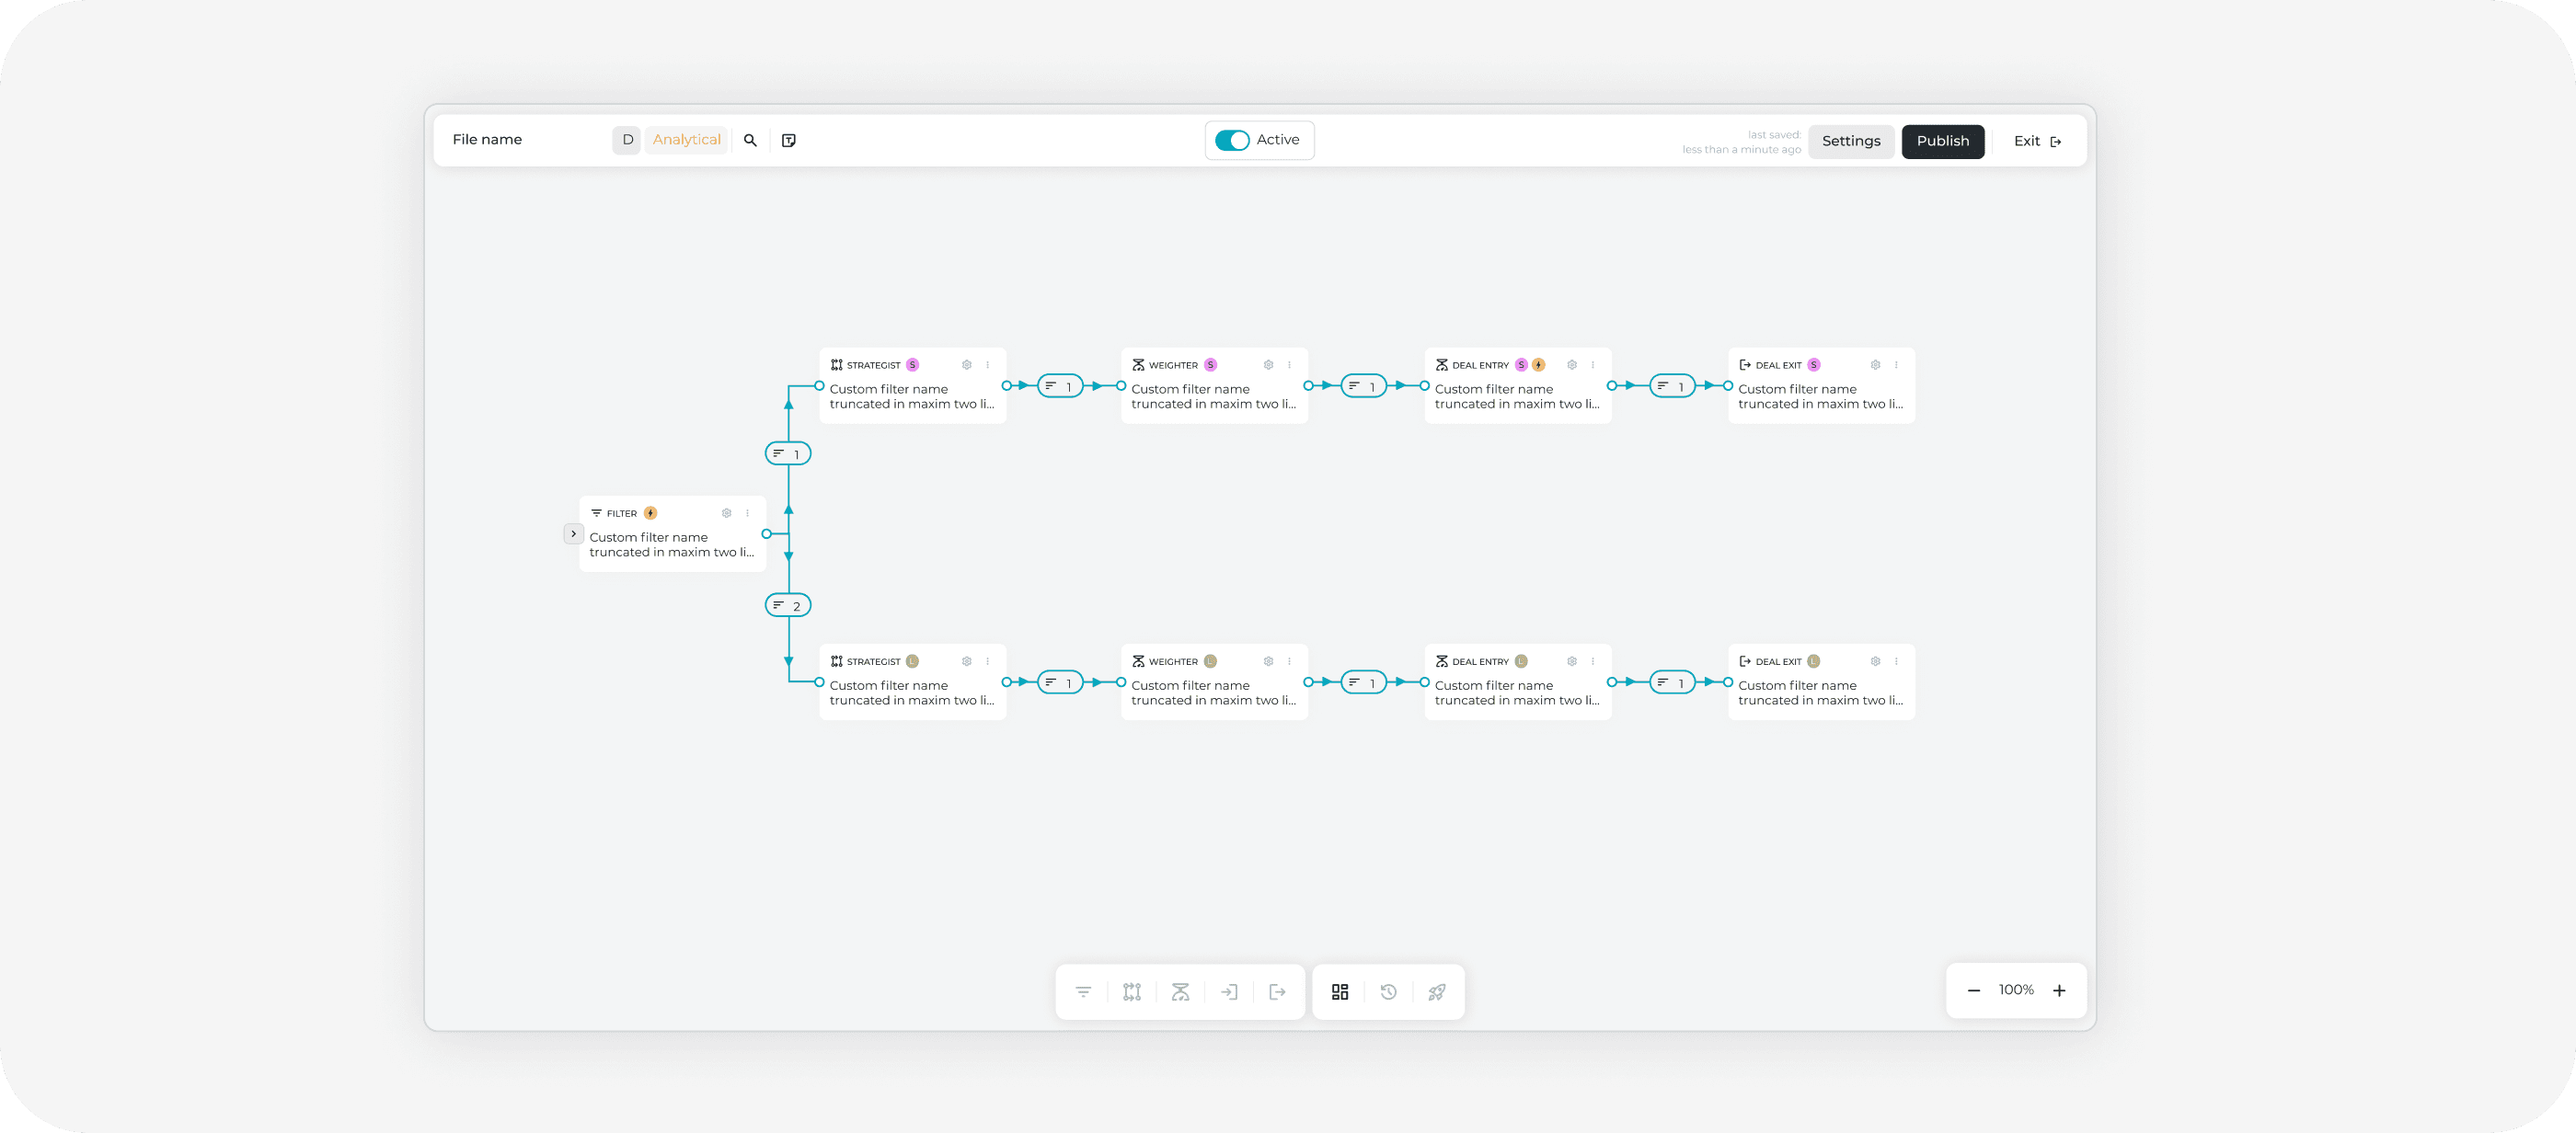
Then I began researching relevant references and designing the concept. We quickly approved the main concept – since it is always a linear process of transferring data from one block to another, I suggested adding some "magic" and animations to show what happens to the strategy when a trigger occurs. This was achieved by animating the arrows and gradually coloring the active blocks.
Next, I enriched the entire process with events, the scope of which we defined with the CEO and backend team. Events are always incoming data (in our case, tickers) or various errors.
For example, when a block is activated, it creates a "cache" that remains unchanged until the next update (or a new chain).
This feature allows users to revisit the strategy at any moment and view any blocking errors that occurred during a cycle by checking the cache.
Since activation is a temporary process that usually happens periodically, we added notifications for the active cycle within the strategy.
This helped track non-blocking errors through real-time observation of the strategy’s performance.
Additionally, during our focus group research, we noticed that in some cases, strategies branched out so much that the viewport size was insufficient.
To address this, we introduced a "monitoring" feature – when an active cycle is running, users can "attach" to the process, and the viewport will automatically follow the active block, keeping it centered.
This allows users to switch between chains while monitoring errors. If an error occurs in one of the chains, users can immediately see the number of blocked chains and switch to them.
Results
After implementing the new approach, users became more efficient in identifying errors in their strategies and had a better understanding of how they performed in real-time.
7 out of 10 users started earning more by identifying and correcting errors that previously lowered their profitability.
2 out of 10 users, who previously didn't generate profits due to faulty strategies, were able to diagnose and fix the issues.
The transparency of the processes improved: users gained more control over their strategies, and with the help of animations and data caching, they developed a clear understanding of what events led to errors.
The monitoring feature simplified the handling of complex strategies, reducing cognitive load.
Let's get in touch!