Optimizing Resource & Budget Management
in Teamplanner

X5 Group (previously known as X5 Retail Group and commonly known as X5) is Russia's largest food retailer. The company operates several retail formats: convenience stores, supermarkets, and hypermarkets, as well as online market, parcel and food delivery services.
Product brief
Teamplanner is an internal resource planning system designed to manage budgets and project teams efficiently. It was created to address the issue of overspending and inefficiencies in workforce planning for internal projects.
One of the key user groups was Compensation & Benefits (C&B) specialists. Their primary tool for managing employee compensation was the Budget and Staffing Schedule — a detailed dataset covering salary classifications, employment terms, organizational structure, contract duration, and pay rates. They relied on it to perform a wide range of daily tasks, from budgeting and payroll adjustments to workforce planning and reporting.
At the time, this information was managed in a massive Excel spreadsheet with 185 columns, actively used by a team of 8–10 specialists. About 75% of the data was exported from an existing ERP system, while the rest had to be manually updated due to system limitations. This approach was inefficient, error-prone, and difficult to scale, highlighting the need for a more structured and user-friendly solution.

Original Excel spreadsheet
Problem
The main issue was the lack of a unified digital record—data wasn’t linked to any corporate system, making it vulnerable and difficult to track.
Additionally, there were other challenges that needed to be addressed:
Time-consuming workflows – manual data updates were inefficient and required significant effort.
Collaboration challenges – multiple users working on the same file led to versioning conflicts.
Data integrity risks – manual input increased the likelihood of errors and lacked proper validation mechanisms.
My role & the team
As a Product Designer, I worked closely with a Business Analyst to gain a deep understanding of business processes. Together, we went through the entire product development cycle — from discovery to delivery.
This included identifying user needs, mapping workflows, conducting research, testing hypotheses, and refining the solution based on feedback.
Challenges
Both the team and I faced several key challenges:
Unclear user workflows: Despite having only 10 users, neither the team nor the users fully understood all the tasks performed with the existing tool. Excel was used as a flexible database, making it difficult to define all use cases upfront.
Limited development capacity: The engineering team had other priorities, so minimizing complex logic and custom UI elements was crucial for efficient implementation.
User habits: Users were accustomed to working in Excel for years, which created resistance to change and required careful consideration when introducing the new tool.
Research & Discovery
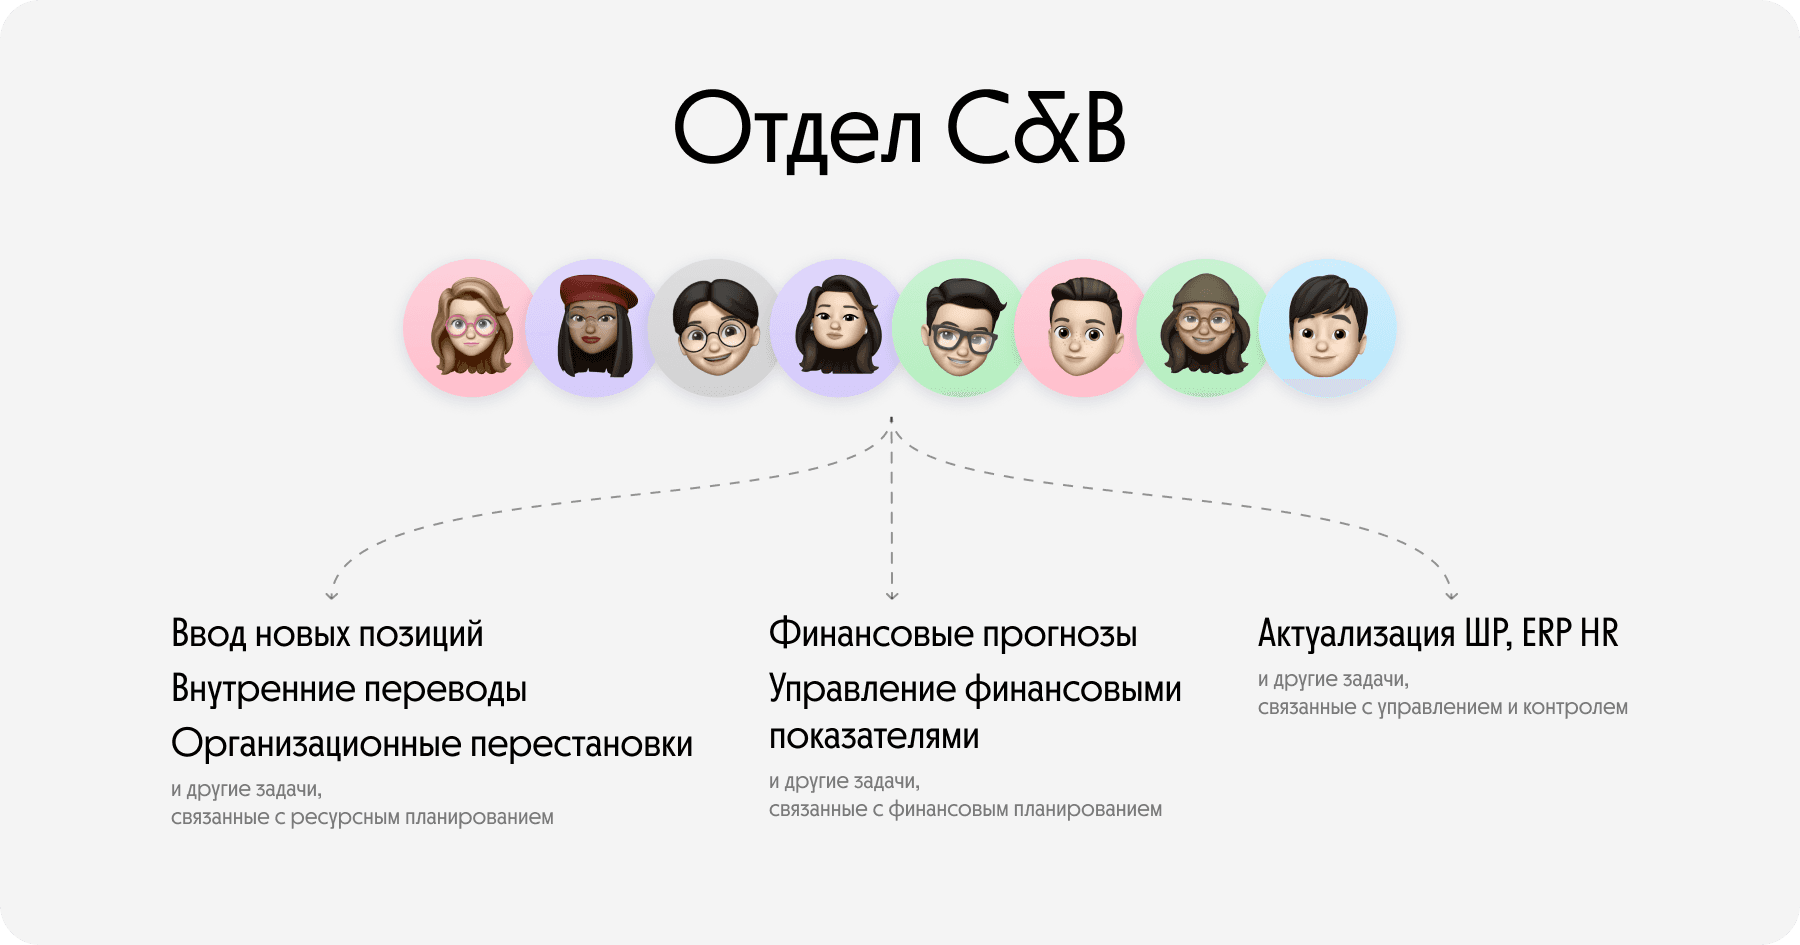
To better understand how employees interacted with the Budget and Staffing Schedule, the Business Analyst and I conducted a series of stakeholder interviews. We observed daily workflows and identified key tasks performed within the tool. Some of the most common and recurring tasks included:
Evaluating staffing changes – assessing the feasibility of new hires, internal transfers, and organizational restructuring.
Financial forecasting and workforce management – ensuring personnel decisions aligned with financial targets.
Keeping employee records up to date – regularly updating staffing information (We didn't realize it at the beginning).
Through these discussions, we discovered that different employees handled different tasks, yet they all worked within the same shared file. Despite having distinct roles, team members were interchangeable, meaning that any specialist could step in to assist with a given task.
In addition to these core functions, we also identified numerous ad-hoc tasks that employees encountered daily, further highlighting the need
for flexibility and complexity in the future system.
Design Approach
Given the overlap in roles and the shared nature of the workflow, splitting the table into separate sections based on tasks and roles wasn’t a viable solution. Users needed access to the full dataset to handle their responsibilities effectively.
Instead, we focused on designing a flexible tool that could accommodate various use cases while maintaining a unified structure. The challenge was to create an intuitive interface that supported different workflows without adding unnecessary complexity for the users.
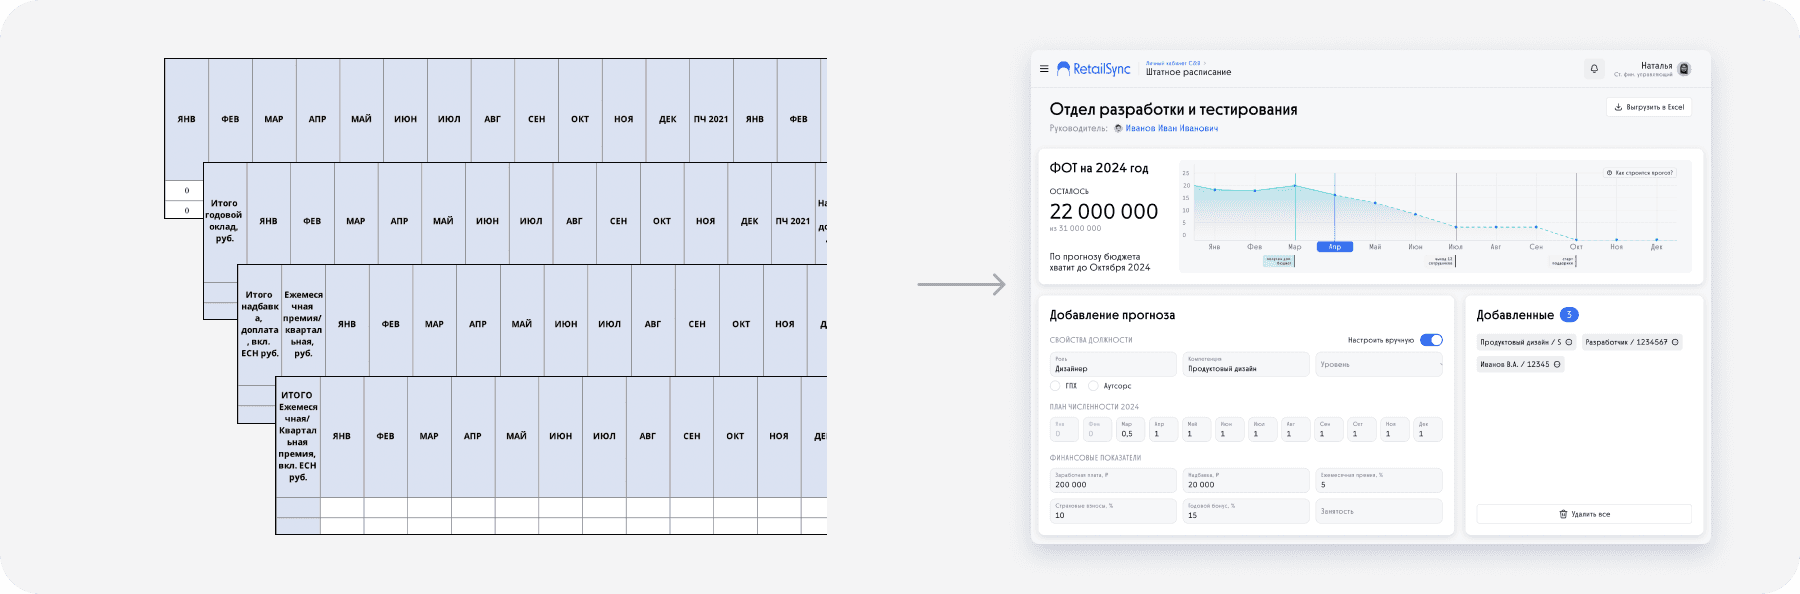
First Concept: Reimagining the Tool
as a Structured Interface
Our initial approach was to move away from the table format entirely, as we saw it as a workaround dictated by Excel’s limitations rather than an optimal solution. Instead, we conceptualized the Budget and Staffing Schedule as a gallery of positions, where each role was represented as a card grouped according to the company’s organizational structure. Each card contained all the relevant attributes previously stored in the spreadsheet.
Since a significant portion of the data was regularly updated from the ERP HR system, we also aimed to eliminate manual updates by introducing automation. We proposed integrating directly with the ERP system to synchronize data daily, removing the need for employees to update the file manually in Excel every month. This would significantly reduce workload and minimize errors.

I built an interactive prototype and conducted user testing to gather feedback. The research revealed a key challenge: user habits formed over years of working with Excel. The complete shift to a new data format confused employees—they struggled to quickly locate familiar attributes and tools. This posed a serious risk of slowing down daily workflows rather than improving efficiency.
To address this, the product team decided on a gradual transition rather than an abrupt overhaul. As an MVP, we retained the familiar table format while incrementally introducing new mechanics and features. This approach allowed users to adapt progressively, reducing friction and ensuring a smoother adoption of the new tool.
Second Concept: Familiar Yet Refined
After defining the main direction for the concept, our focus shifted to addressing technical limitations and improving the user experience with the table.

How we analyzed the spreadsheet
Firstly, we needed to reduce the table size, as the table component wasn't optimized for handling a large number of columns, which led to slow page load times.
Secondly, it was crucial to consider the context of use, avoiding radical changes and building on the product's current capabilities.
Reducing table size
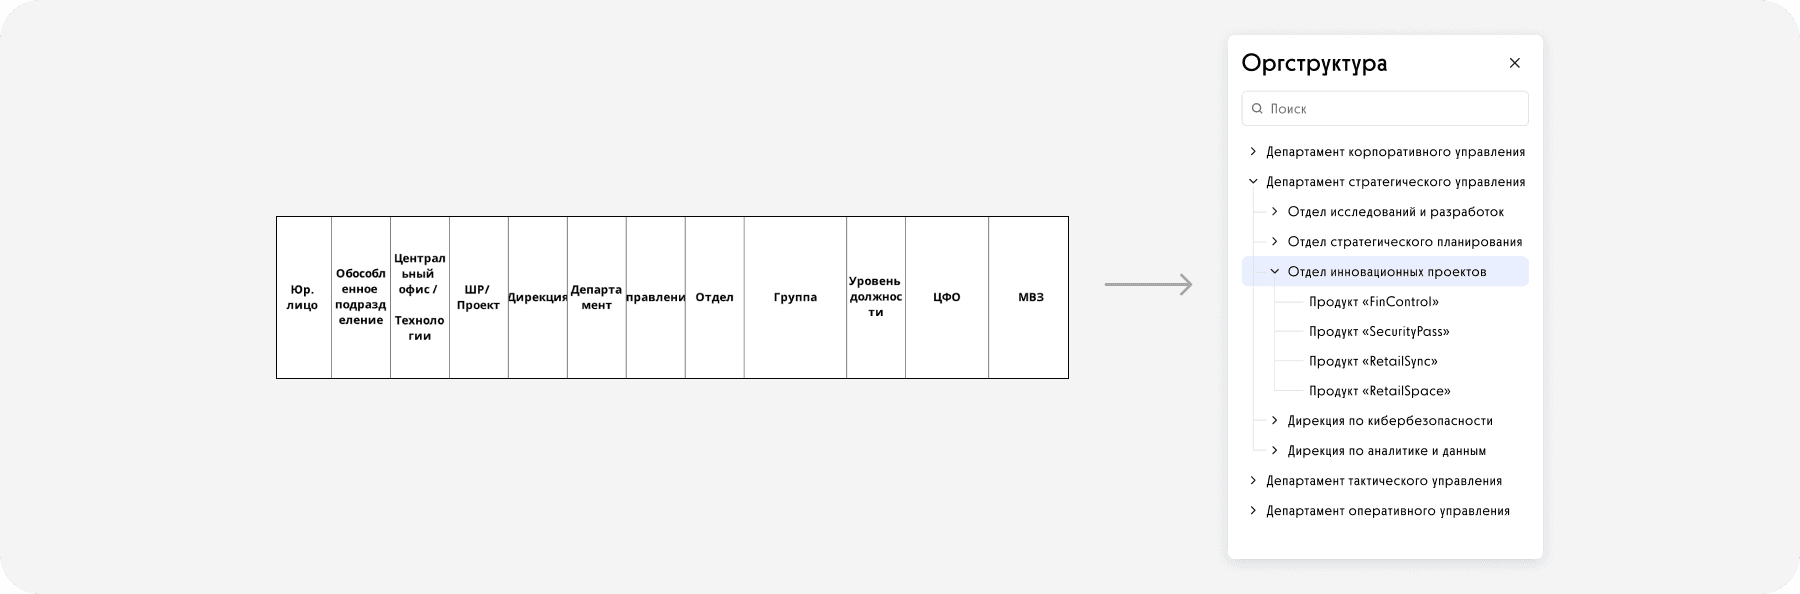
The first 32 columns of the table represented organizational structure levels, which were primarily used for filtering. To optimize this, we transformed these columns into a side-filter tree based on the organizational structure.
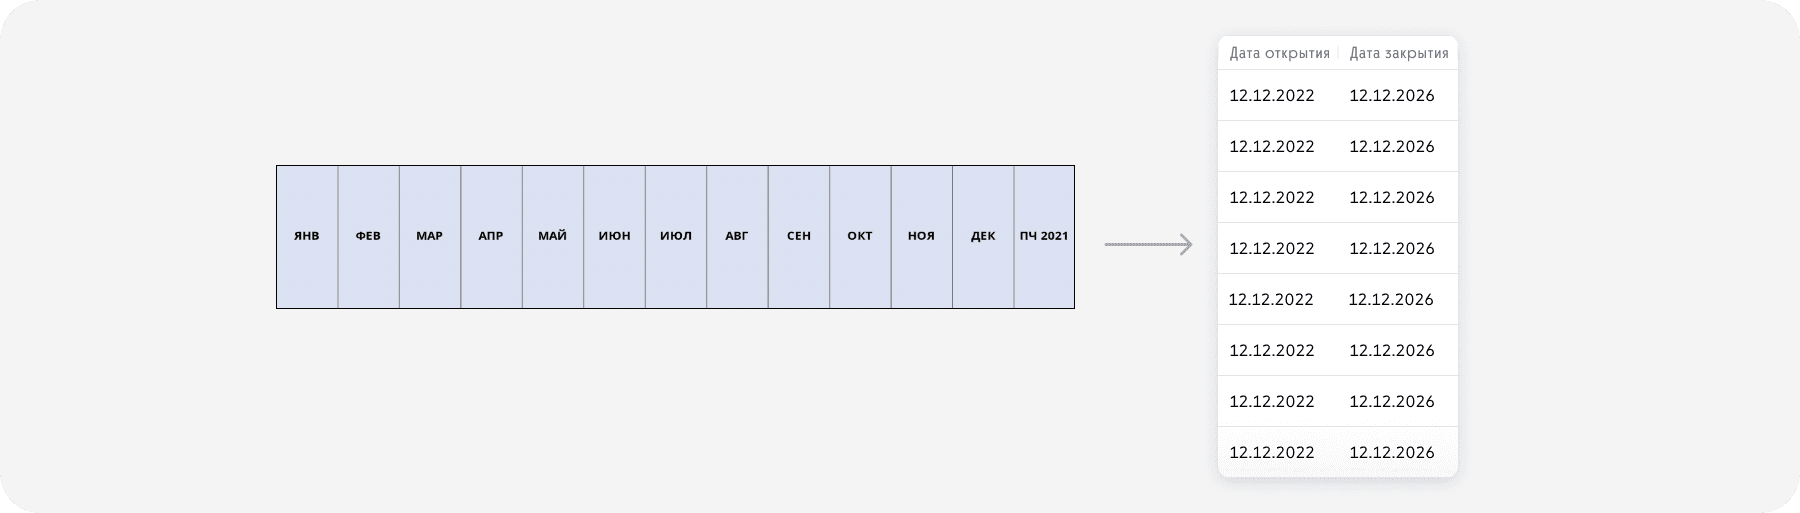
We also discovered 24 columns representing months, with values ranging from
0 to 1, resembling two calendars. It took us 3 meetings to understand the purpose of each:
The first "calendar" (or Headcount Plan) was used to display the entry and exit dates for positions. This format had evolved historically but had become unnecessary over time. We decided to replace it with two separate columns: "Start Date" and "End Date."
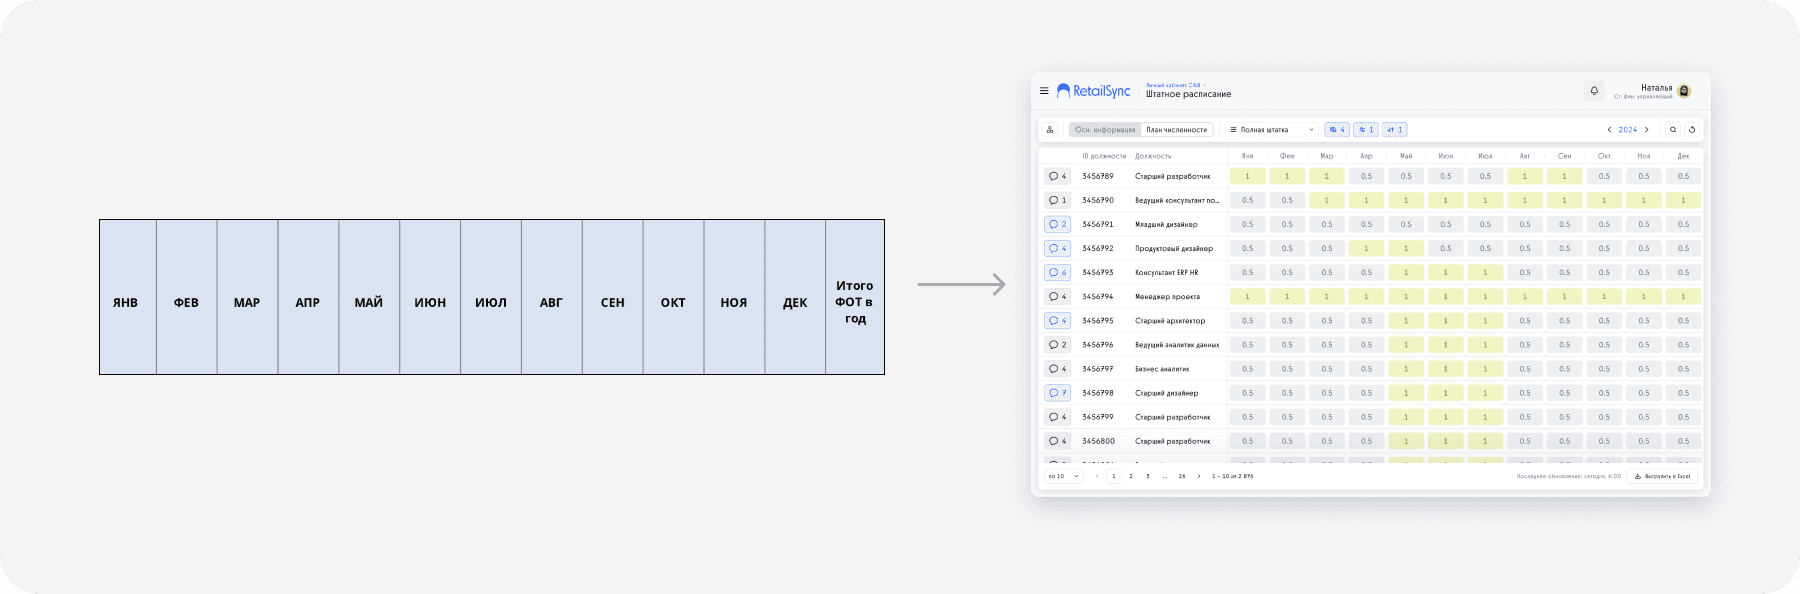
The second "calendar" (or Budget Plan) reflected the amount of work performed by an employee each month. For example, if someone worked full-time in May, the value in the corresponding column would be 1. These values were typically filled when the position was created and rarely changed. We decided to remove these columns from the main table, moving them to the position page, and created a separate table for bulk data management.
Next, we examined 7 sections of the table, each consisting of 12 monthly columns, totaling 84 columns. Each section represented a specific cost item (e.g., salary or bonus), broken down by month. The data was automatically calculated and depended on the values entered in the Budget Plan.
We discovered that these data were managed by other teams, and they were not necessary for the work with the Staffing Plan. As a result, we moved this part of the data to a separate tool.
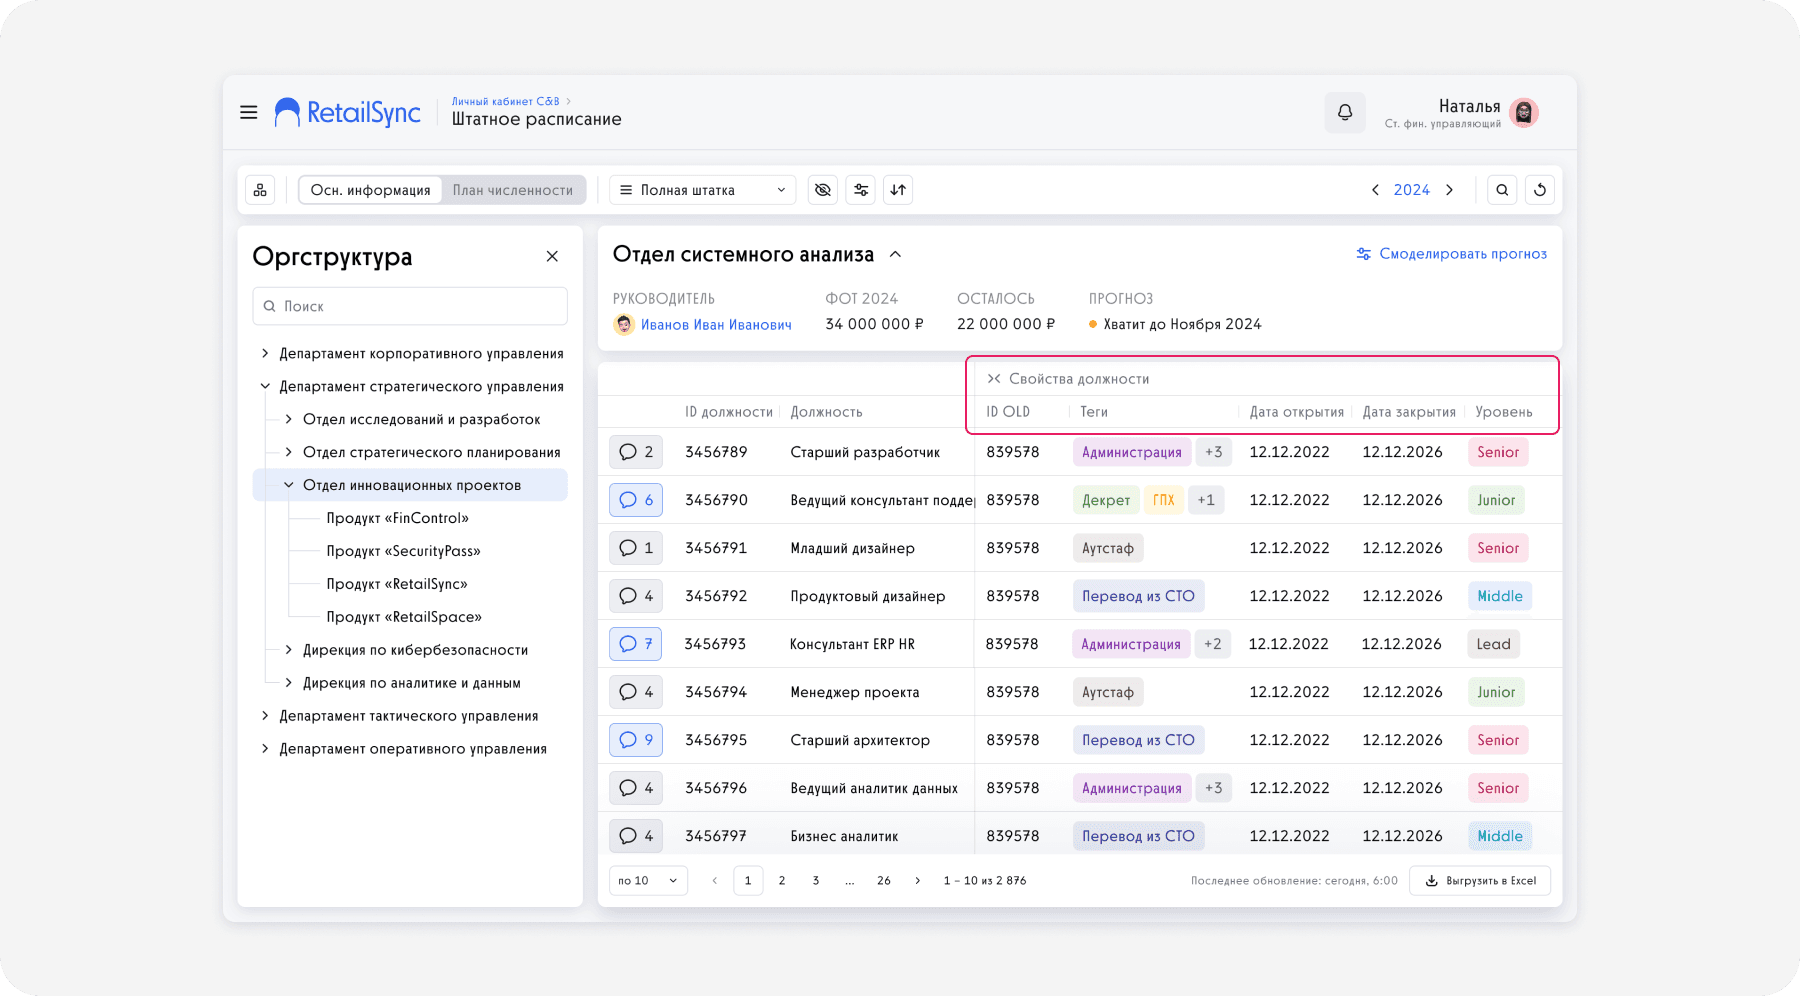
Additionally, the table contained 6 columns for notes. We identified a key pain point: employees often overlooked these notes because they blended in with the rest of the data. To address this, we transformed the six columns into two:
One column with colored tags.
A fixed-scroll column for comments, which included a read indicator for each user.

Refining user experience
In addition to reducing the table size, we proposed several solutions to make the tool more user-friendly:
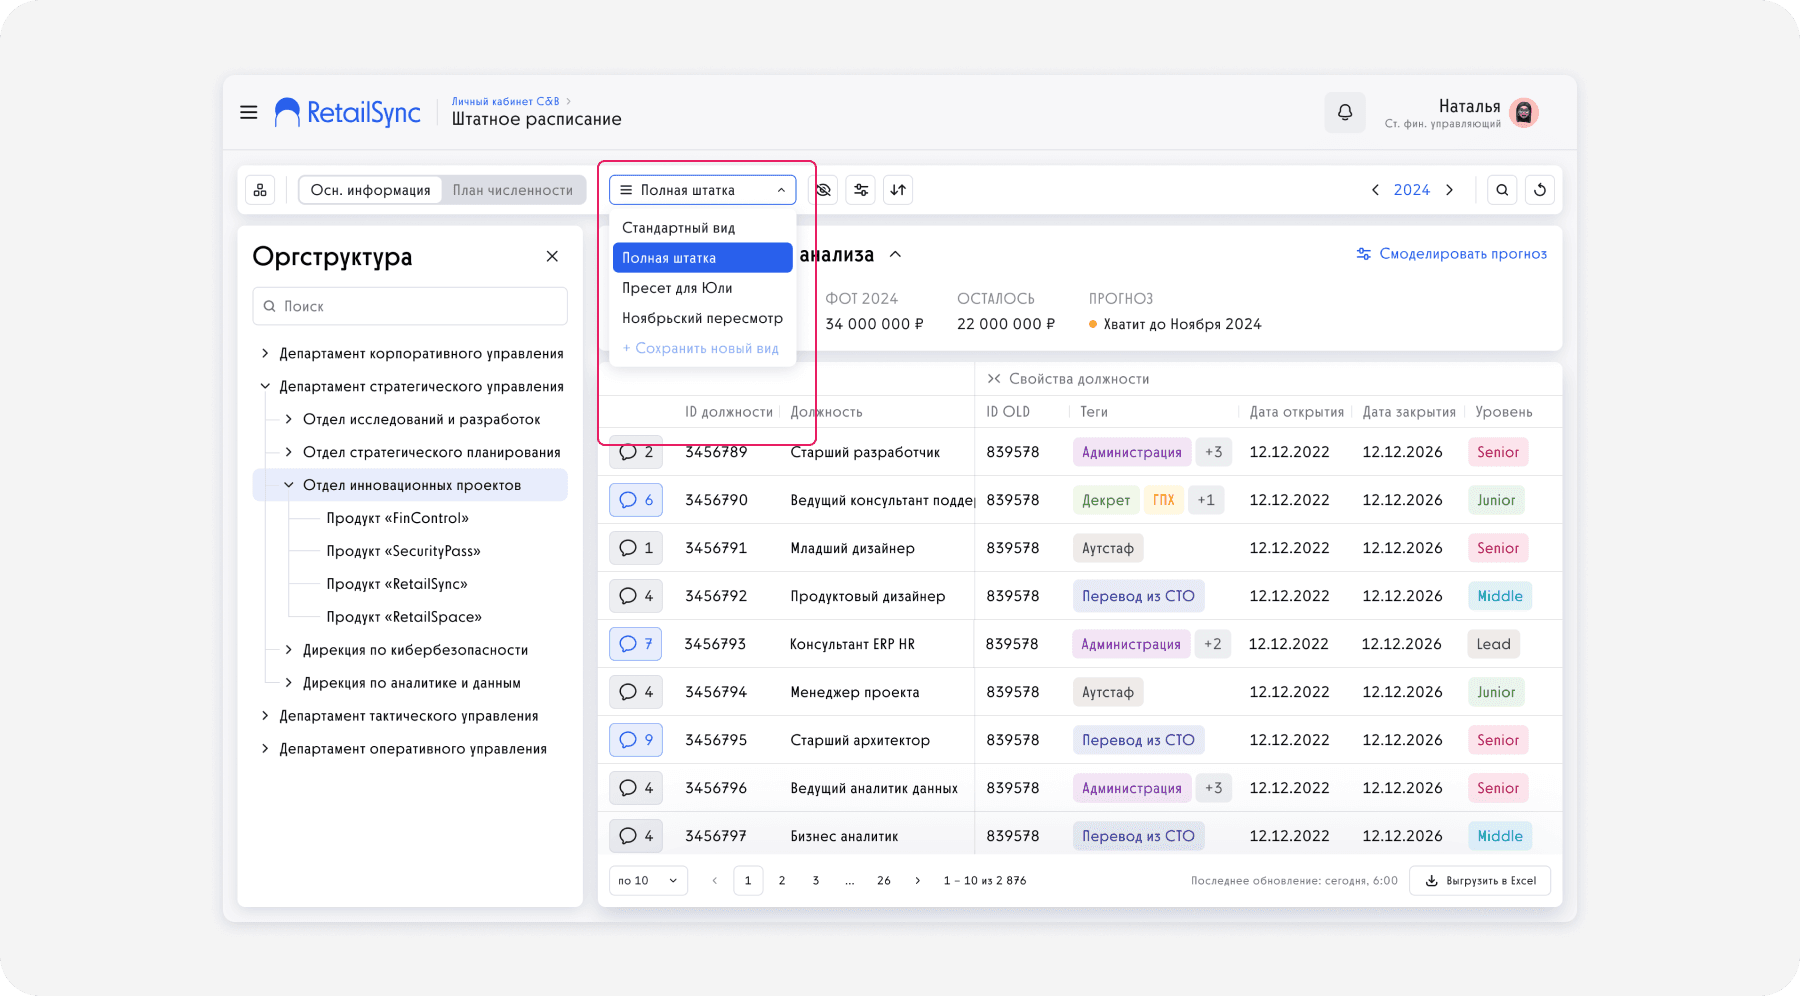
We simplified navigation through the large number of columns by grouping them into thematic blocks. Users can now hide unnecessary blocks when they're not needed for a specific task.
Since different tasks require unique dataset, we added customization options for the table. Users can now hide, expand, and rearrange columns, as well as save their preferences in the form of a custom table.
To enrich the Staffing Plan with data through our system, it was crucial to add data editing capabilities. Given the large volume of data in the table (around 5,000 rows), direct cell editing could negatively impact performance.
We moved data configuration and editing to a side page. This approach allowed us to create a separate workspace for the user, avoiding system overload while keeping the table non-editable.
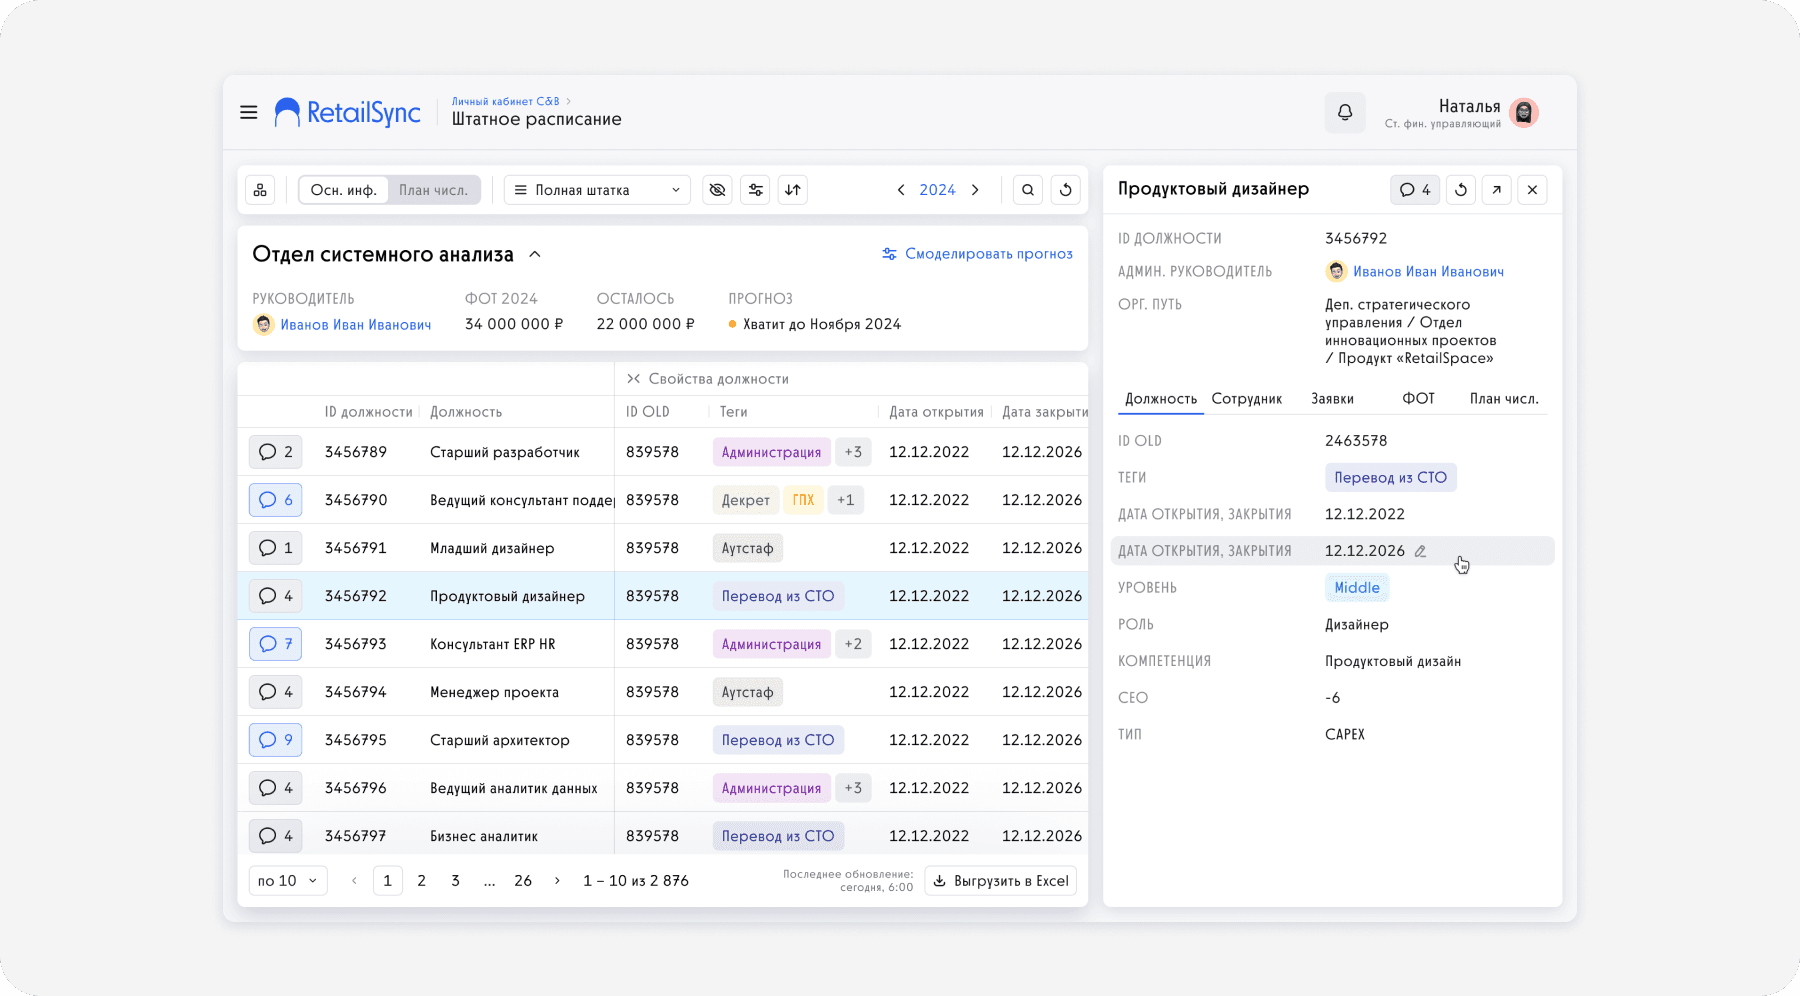
To create a digital audit trail, we developed a flexible change history component, which the team now uses across various sections and even in other products.

Results
During the second iteration, we made significant improvements by reducing the table size from 185 to 56 columns, after which we handed the tool over to the development team.
Although the full transition from Excel to our product took about six months, the results were impressive, and the team received a lot of positive feedback.
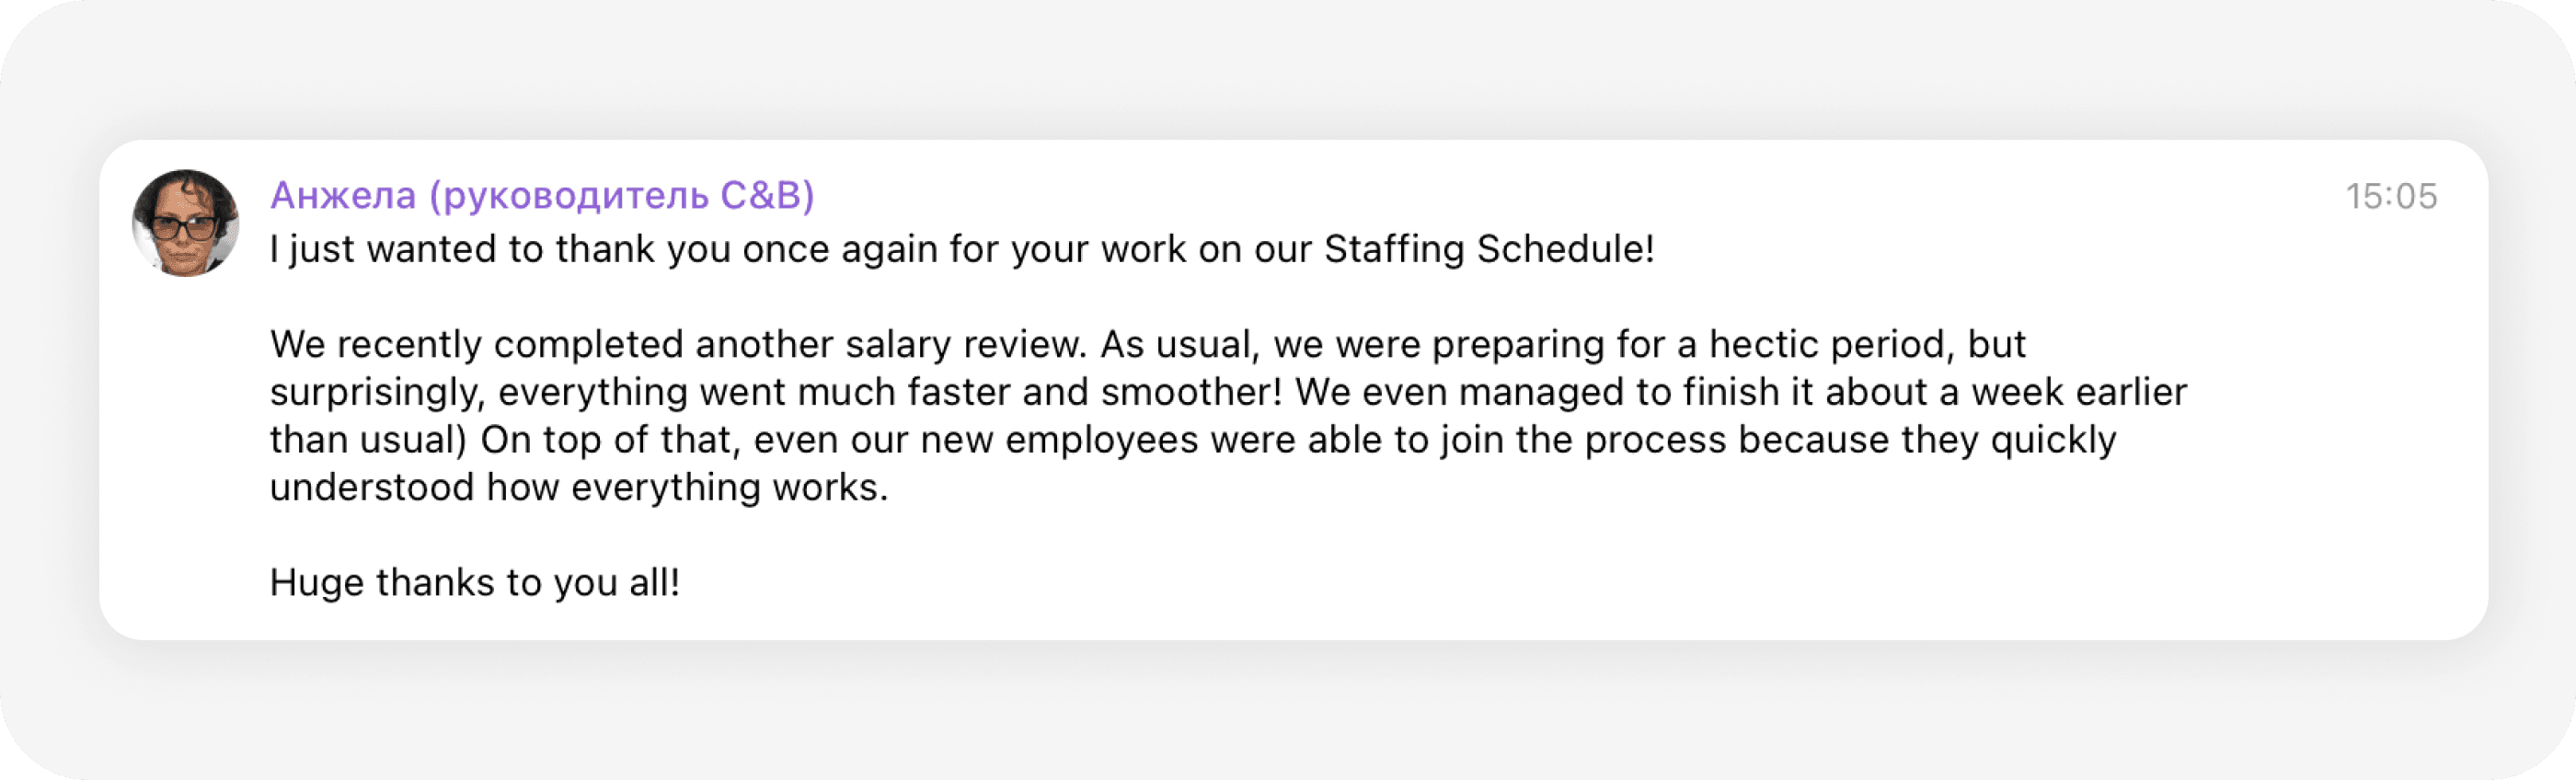
Message we received from the C&B department head (translated)
Since then, I’ve passed the responsibility for further development of the tool to the designers in my team. They continue to actively identify growth opportunities and are awaiting the development of user patterns to smoothly transition to the next stage of the tool’s evolution.
Lessons learned
When creating any solution, it’s essential to deeply understand the context. Users may have ideas for the perfect interface, but it’s important to immerse yourself in the task to ensure the solution meets their needs, even if it seems obvious at first.
Innovation is great, but it’s important to introduce it gradually. Avoid drastic changes when transforming existing processes. Consider established user patterns and give people time to adapt, ensuring workflow efficiency is maintained.
Let's get in touch!